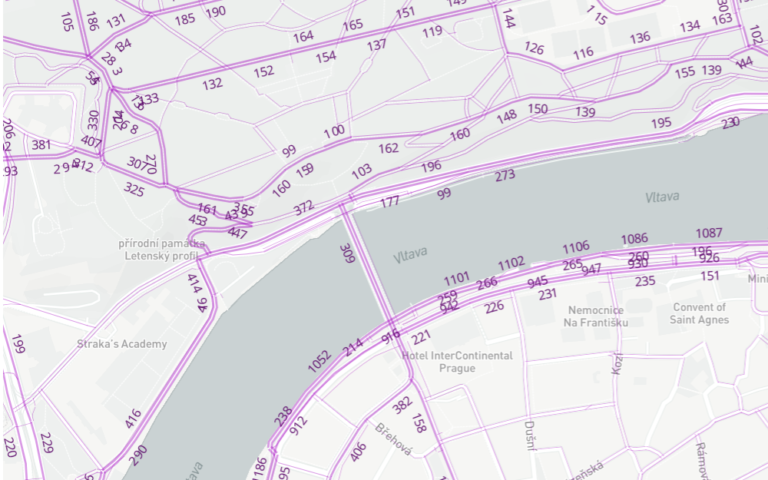
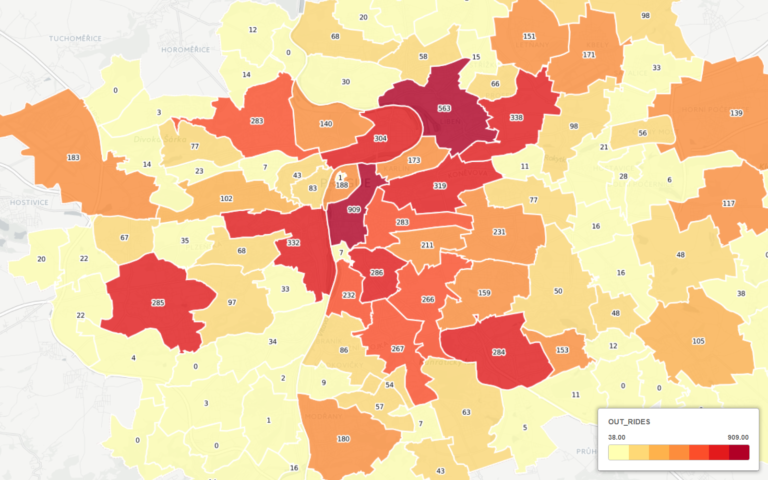
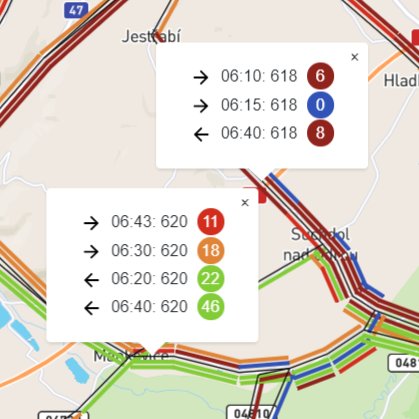
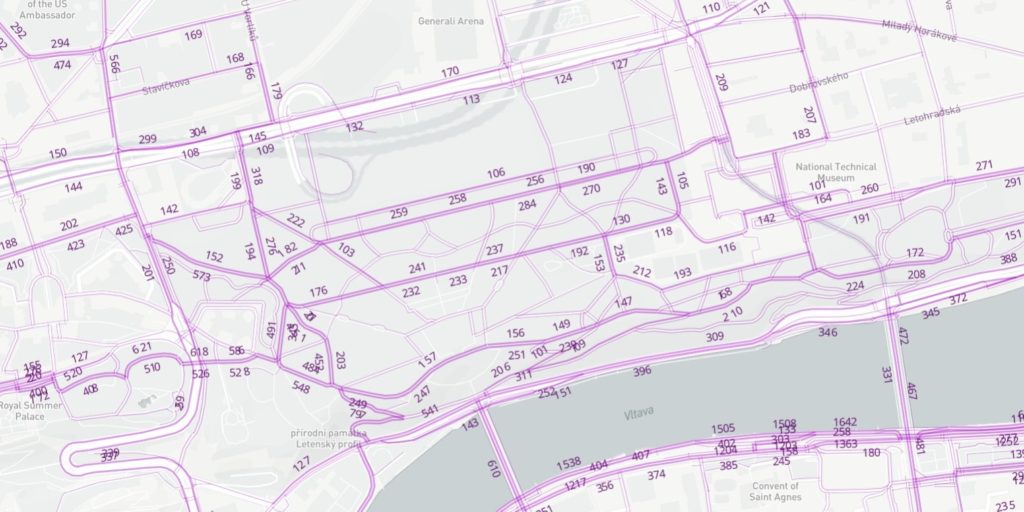
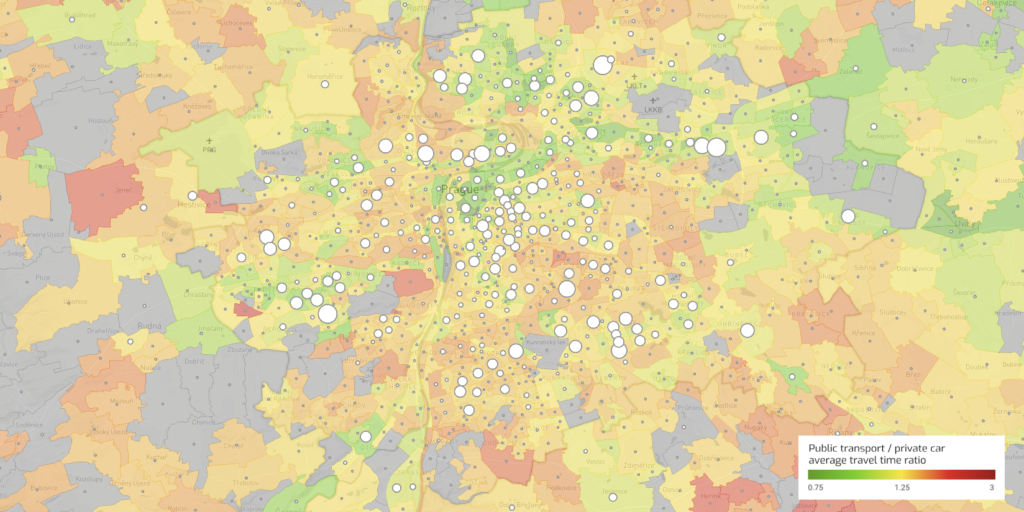
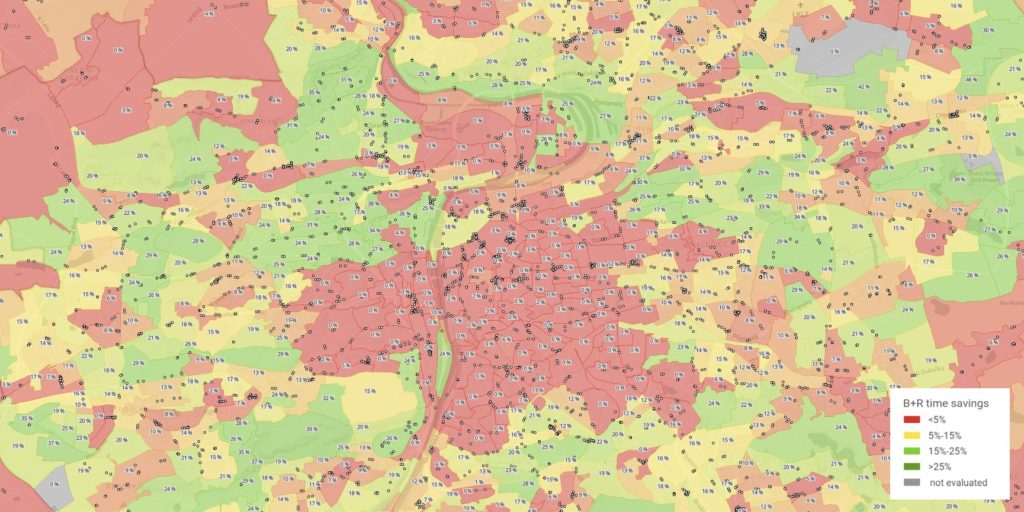
For a public transport authority (PTA) we have calculated ridership statistics from hundreds of GBs of ticket purchase data. Our analysis provided the PTA with accurate information on how many riders of which category use each public transport service at different times. A challenge here was to reliably map purchase transactions from multiple transport operators to the underlying public transport timetables and to build an interactive map-based data visualization that conveyed the insights the PTA needed to plan optimization of the public transport network.
Data-Driven
Mobility Analytics
Understand and optimize the performance of your transport system


